

Transactions and price evolution
When purchasing a house in Belgium, investors pay the asking price plus registration rights at an average of 12%
This makes buying a house in Belgium a long-term investment.
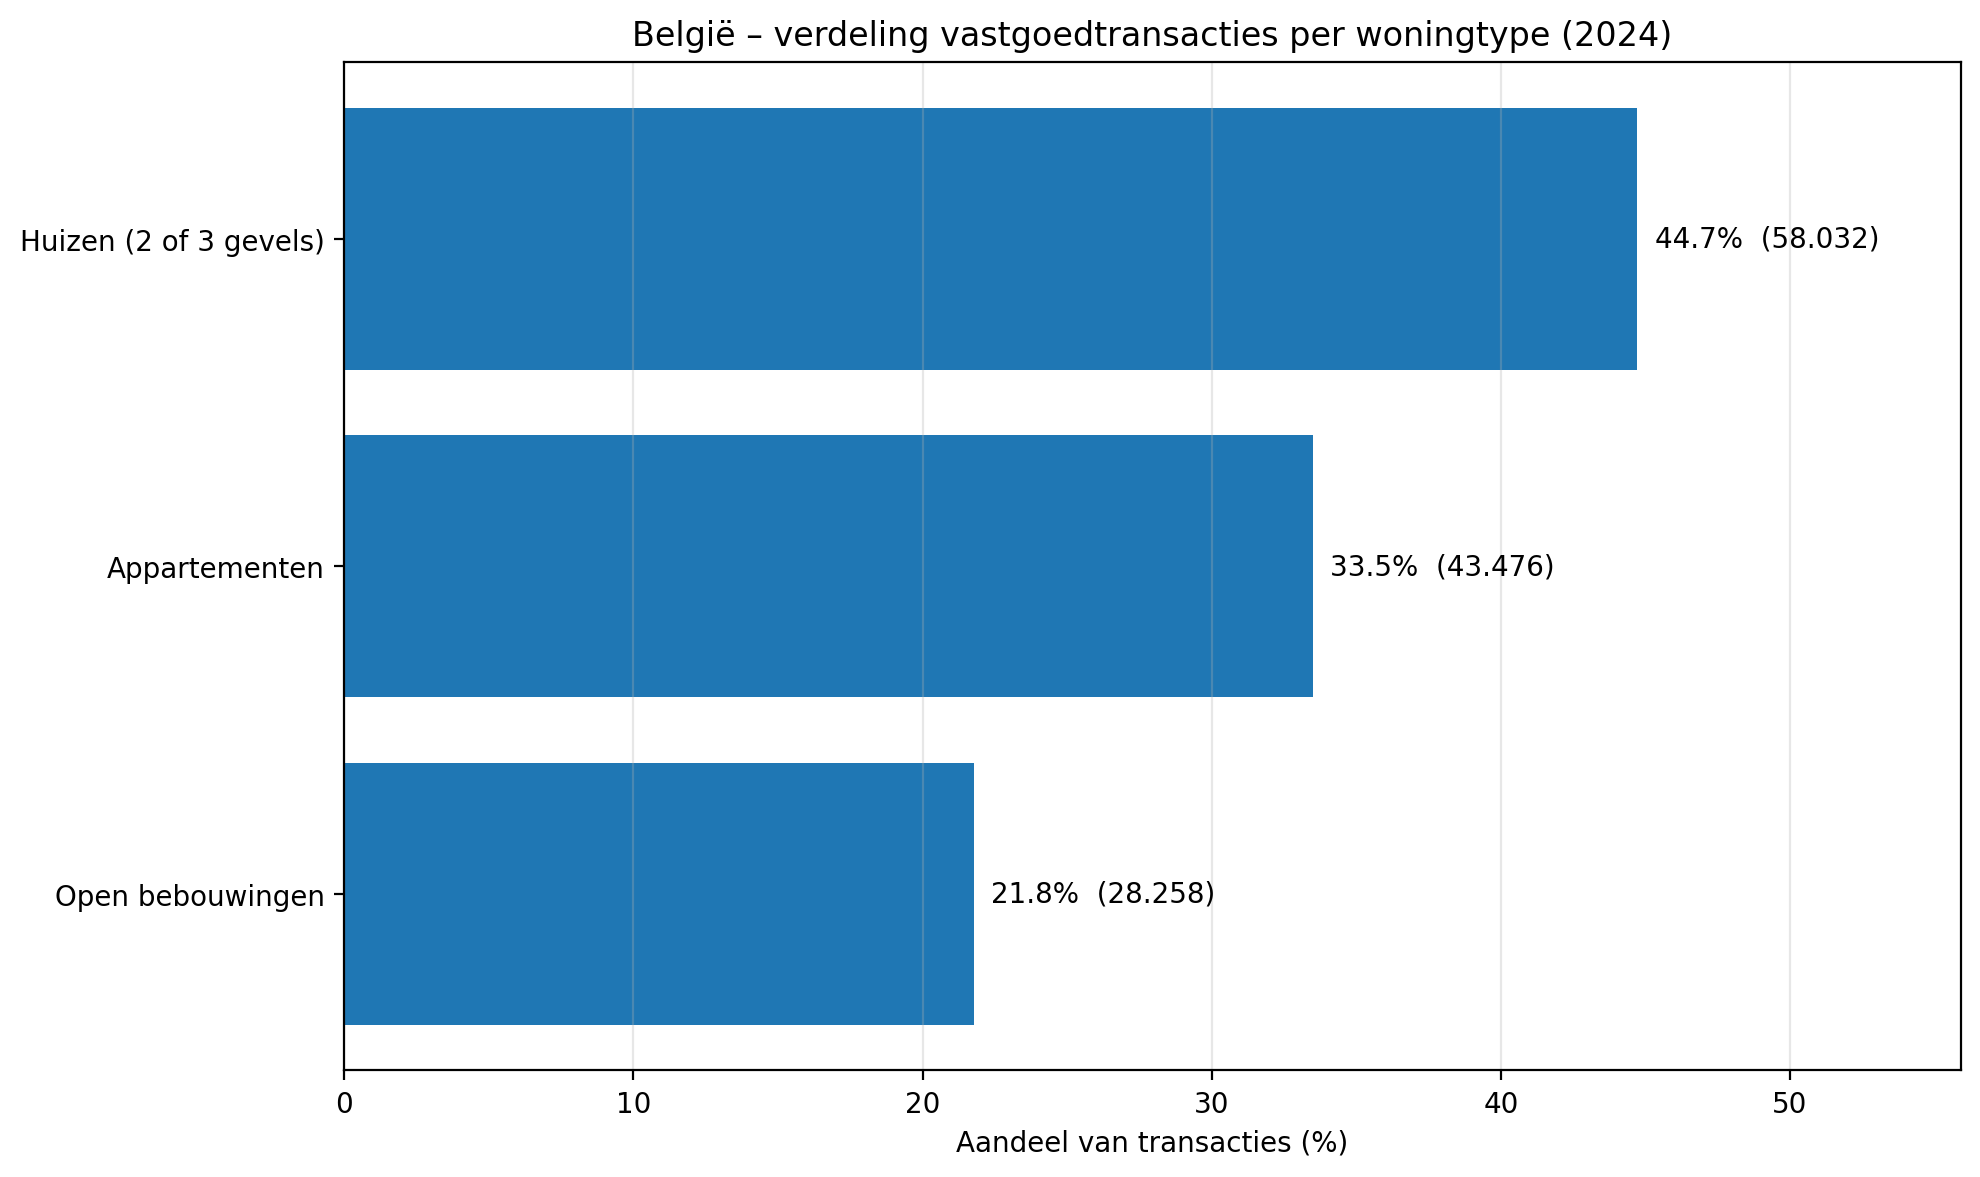
Transaction quantities in 2024
Per category 1/ Houses with 2 or 3 outside walls. 2/Apartments. 3/ -Detached houses
Source: Statbel
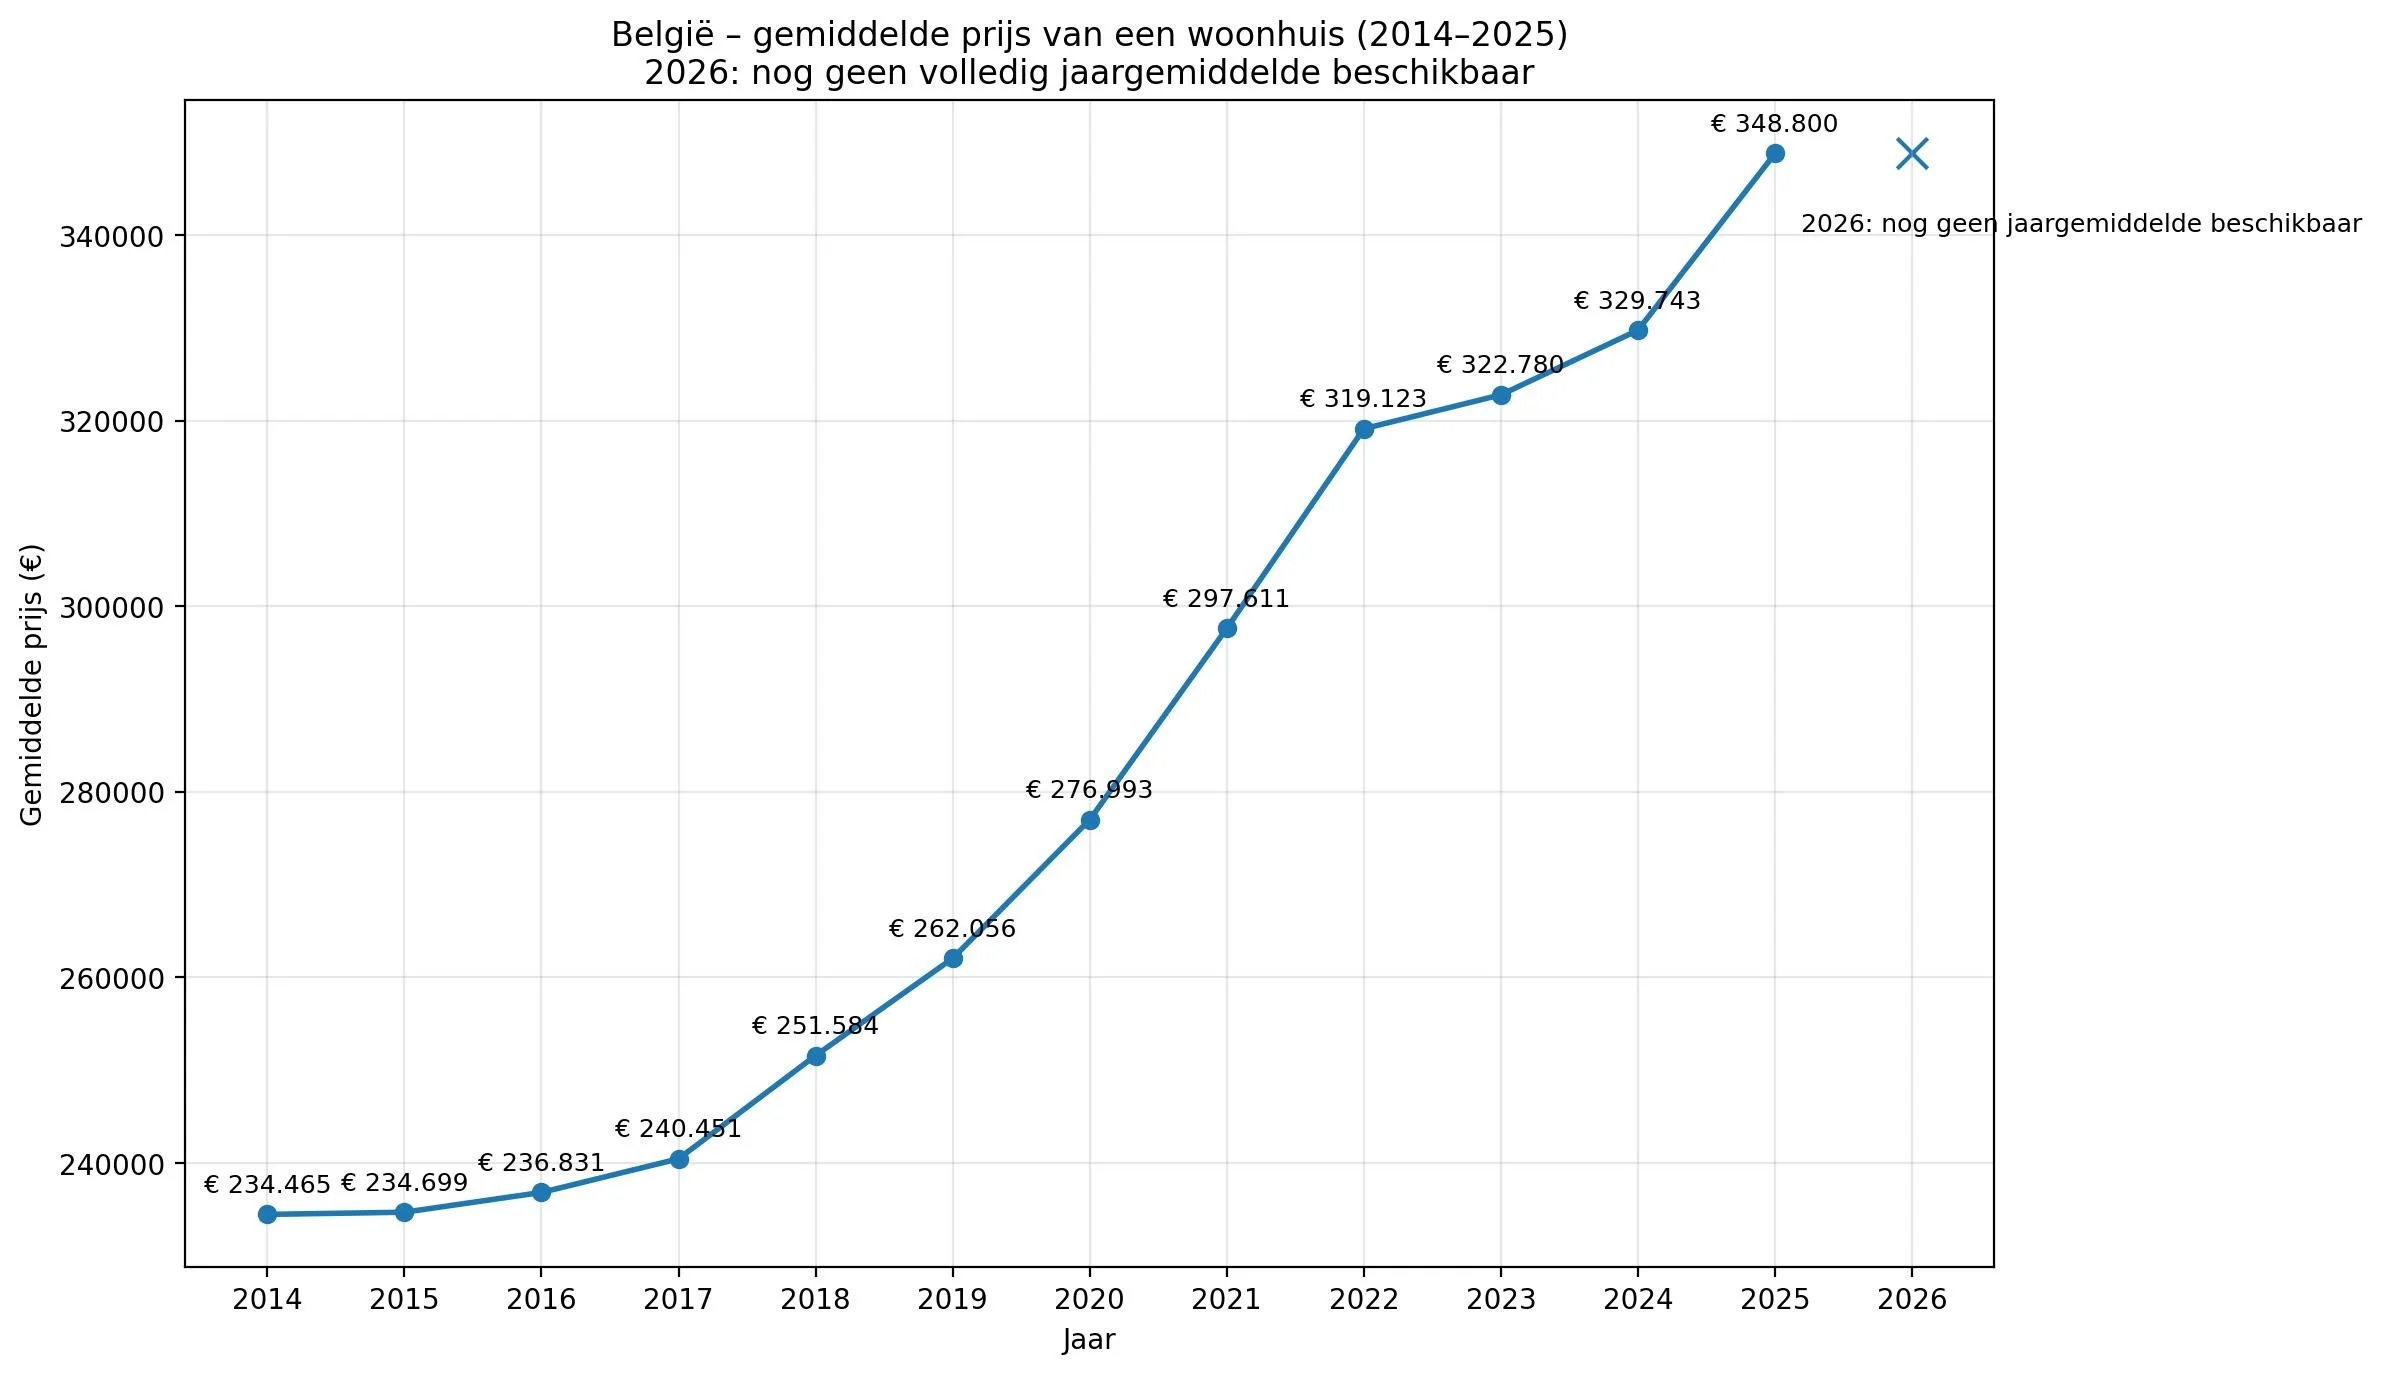
Evolution Belgian residential housing prices
2014 - 2025
Source Stable
Some related articles…
-
Is the real estate market truly recovering? Here’s what the numbers show.
09 JAN 2026
In recent years, the Belgian real estate market has been under pressure due to rising interest rates and uncertainty among buyers and sellers. However, the latest Real Estate Barometer shows a clear turnaround: the market is picking up again, with more transactions and rising prices.
The market is gaining momentum
After some difficult years, the number of property transactions has been increasing since 2025 for three consecutive quarters. This points to renewed confidence among buyers and sellers.
In the first nine months of 2025, about 15 percent more homes were sold compared to the same period in 2024. This growth is visible across all regions, with Flanders and Wallonia leading the way and Brussels following the same trend.
Prices on the rise
Evolution of real estate prices
· The average price of a house today is €346,218 (+5%).
· In Wallonia, prices are rising even more sharply, by nearly +13%.
· Apartment prices remain more stable: €275,862 (+1.7%), keeping this segment attractive for first-time buyers.
The buyer profile is shifting slightly. The average house buyer is 38 years old, while for apartments it is 43. Young adults, in particular, are finding their way back to the market more often.
What does this mean for you?
· Buyers: Competition is increasing, especially for houses. Apartments remain a more accessible entry point.
· Sellers: Rising demand increases the likelihood of a smooth sale.
· First-time buyers: Apartments still offer the most affordable access to the market.
Future perspective
Although the market is clearly recovering, it remains sensitive to interest rate developments and economic conditions. For major real estate decisions, good advice and local market knowledge are essential.
Source: Fednot
-
Belgium is experiencing the second highest real estate price growth in Europe, with costs climbing 11.8% to a total of €2,169 per square metre since the start of the coronavirus pandemic in March 2020.
Only Germany has seen a higher rise (+23.5%) in price per square metre, according to figures from real estate website Immoweb. The current Belgian price of €2,169/m2 represents an increase of almost 6.3% in just one year.
“This price dynamic is driven by Brussels, with €3,329/m2, followed by the Flemish Region with €2,263/m2 and Wallonia with €1,638/m2,” Immoweb explained.
Still, Belgium has some of the lowest property prices in Europe, along with Italy (€1,684/m2) and Spain (€1,824/m2).
The United Kingdom (€3,638/m2) is the most expensive country in the region, followed by Germany and France, which have an average price of €3,006/m2.
The attractiveness of urban areas also seems to be declining, Immoweb reports.
“With the health crisis, teleworking has become more widespread, forcing companies to review their work policies,”said Immoweb managing director Piet Derriks.
“At the same time, successive confinements have created new expectations among European households. As a result, more and more Europeans have turned to cheaper real estate in suburban areas.”
Cheaper than other European cities, but prices likely to keep rising
Immoweb pointed out that despite the increase, the purchasing power of a two-person household is on average 66m2 in Brussels, making it one of the most accessible European capitals, ahead of Lisbon, Berlin, Madrid, Paris, London and Rome.
Nevertheless, the surge in home prices in Belgium has had a significant effect, in particular when it comes to young people’s ability to purchase their first home.
A recent report from the National Bank of Belgium found that residential property price growth has affected all regions of the country and all types of properties, from townhouses and villas to apartments.
The average amount borrowed for the purchase of a home rose from €135,100 at the end of 2020 to €144,300 in November 2021.
National Bank governor Pierre Wunsch said real estate costs will continue to rise, complicated by scarcity in the housing market.
“Today, real estate prices are rising because there is scarcity – if you want to live in the centre of Brussels, you will pay more than the cost of building an apartment or house in Brussels,” Wunsch explained.
“We have real concern in this regard. If at some point we don't build more housing, we won't have a safety valve.”
Written by Helen Lyons
-
Surprisingly, Belgian house prices continue to rise, despite falling property transactions due to the abolition of “woonbonus” in Flanders coupled with the adverse impact of the COVID-19 pandemic.
During 2020, the nationwide house price index in Belgium rose by 5.74% (5.16% inflation-adjusted), the highest y-o-y rise since 2007, according to Statistics Belgium. Quarter-on-quarter, the overall index increased 2.2% in Q4 2020 (2.33% inflation-adjusted).
Existing dwelling prices rose strongly by 7.38% y-o-y in 2020 (6.78% inflation-adjusted). New dwelling prices rose by 5.21% (4.62% inflation-adjusted).During 2020, the total number of residential property transactions in Belgium fell by about 18% y-o-y to 122,435 units, mainly due to the abolition in Flanders of the “woonbonus” rules last year (a system of tax deductions for people with a mortgage), aggravated by the adverse impact of the pandemic. The sharp decline in transactions last year was in stark contrast to the y-o-y rises of 14.8% in 2019, 5.2% in 2018, 4% in 2017 and 15% in 2016.
Residential construction activity remains more or less steady. In 2020, new residential building permits authorized in Belgium rose by 4.4% y-o-y to 28,645, according to Statistics Belgium
During Belgium’s housing boom (2000-Q3 2008), nationwide house prices soared by 129% (86% inflation-adjusted). Since the crisis, house prices have followed the economy. When the economy was strong, house prices rose. When the economy was weak, house prices stagnated.
When the economy emerged from recession in 2011, the housing market bounced back strongly with Brussels house prices surging by 9.58% (5.7% inflation-adjusted). After then house prices rose slowly, by an annual average of just 1.2% in 2012-2015. Since then the pace has quickened. House prices rose by 2.54% in 2016, 3.55% in 2017, 2.52% in 2018, and 4.78% in 2019, on the back of improved economic growth.
House prices are expected to rise strongly this year (2021-2022).
In Q1 2021, the Belgian economy shrunk slightly by 0.6% from a year earlier, its fifth consecutive quarter of y-o-y declines amidst the coronavirus crisis. The economy is expected to return to growth this year, with a projected real GDP growth rate of 4.5%, following a contraction of 6.3% last year, according to the European Commission.
There are no foreign ownership restrictions in acquiring Belgian property.
Regional house price variations
Belgium is divided into three regions:
the Flemish Region that occupies the northern half with Dutch-speaking communities;
the Walloon Region which occupies the southern-half and is made-up largely of French-speaking communities, with a small German-speaking community in the south-east; and
Brussels, the administrative capital region, an officially tri-lingual city inside the Flemish region.
Each region and community has a separate parliament and executive administration, with power increasingly devolved. There is persisting ethnic conflict, and the political union has come under rising threat.
Property prices in Belgium’s three regions move in the same price cycle, but the capital has registered much the highest price increases. Prices in Brussels surged almost 200% (140% in real terms) from 1998 to 2008, much more than in the two other regions (143% for the Flemish region and 116% in Walloon), according to Statistics Belgium.
The drivers of Belgium’s house price boom were:
rapid mortgage market expansion, due to low interest rates and increased competition between banks; and economic and wage growth.
When these conditions were reversed with the global credit crunch, house price rises slowed sharply. From 2009 to 2019, house prices in Brussels increased by only 28% (7% in real terms).
In the Flemish and Walloon regions, prices rose in 2009-2019 by 37% (15% in real terms) and 27% (6% in real terms), respectively.
Surprisingly house price growth has noticeably strengthened last year despite the pandemic.
During 2020:
In Brussels-Capital region, the median price of closed or semi-closed type houses rose by 8.8% y-o-y to €435,000 (US$526,739) and by 11% y-o-y to €960,000 (US$1.16 million) for open type houses. Apartment prices also increased strongly by 8.6% to €228,000 (US$276,084).
In the Flemish region (Flanders), the median prices of closed/semi-closed, and open type houses rose by 3.8% to €249,000 (US$301,513) and by 5.8% to €349,000 (US$422,602), respectively. Apartment prices increased 7.7% y-o-y to €210,000 (US$254,288) last year.
In the Walloon region (Wallonia), closed/semi-closed house prices rose by 4.7% y-o-y in 2020 to €155,000 (US$187,689) while open type house prices were up 5.8% to €254,000 (US$307,568). The median price of apartments rose by 4.7% y-o-y to €155,000 (US$187,689).
Belgian house prices. These figures are derived from the European Central Bank, and stretch back to 1990. Statistics Belgium releases rich data on four different categories of dwelling and land prices, stretching back to 1985. Stadim also publishes annual indices starting in 1960Description text goes here
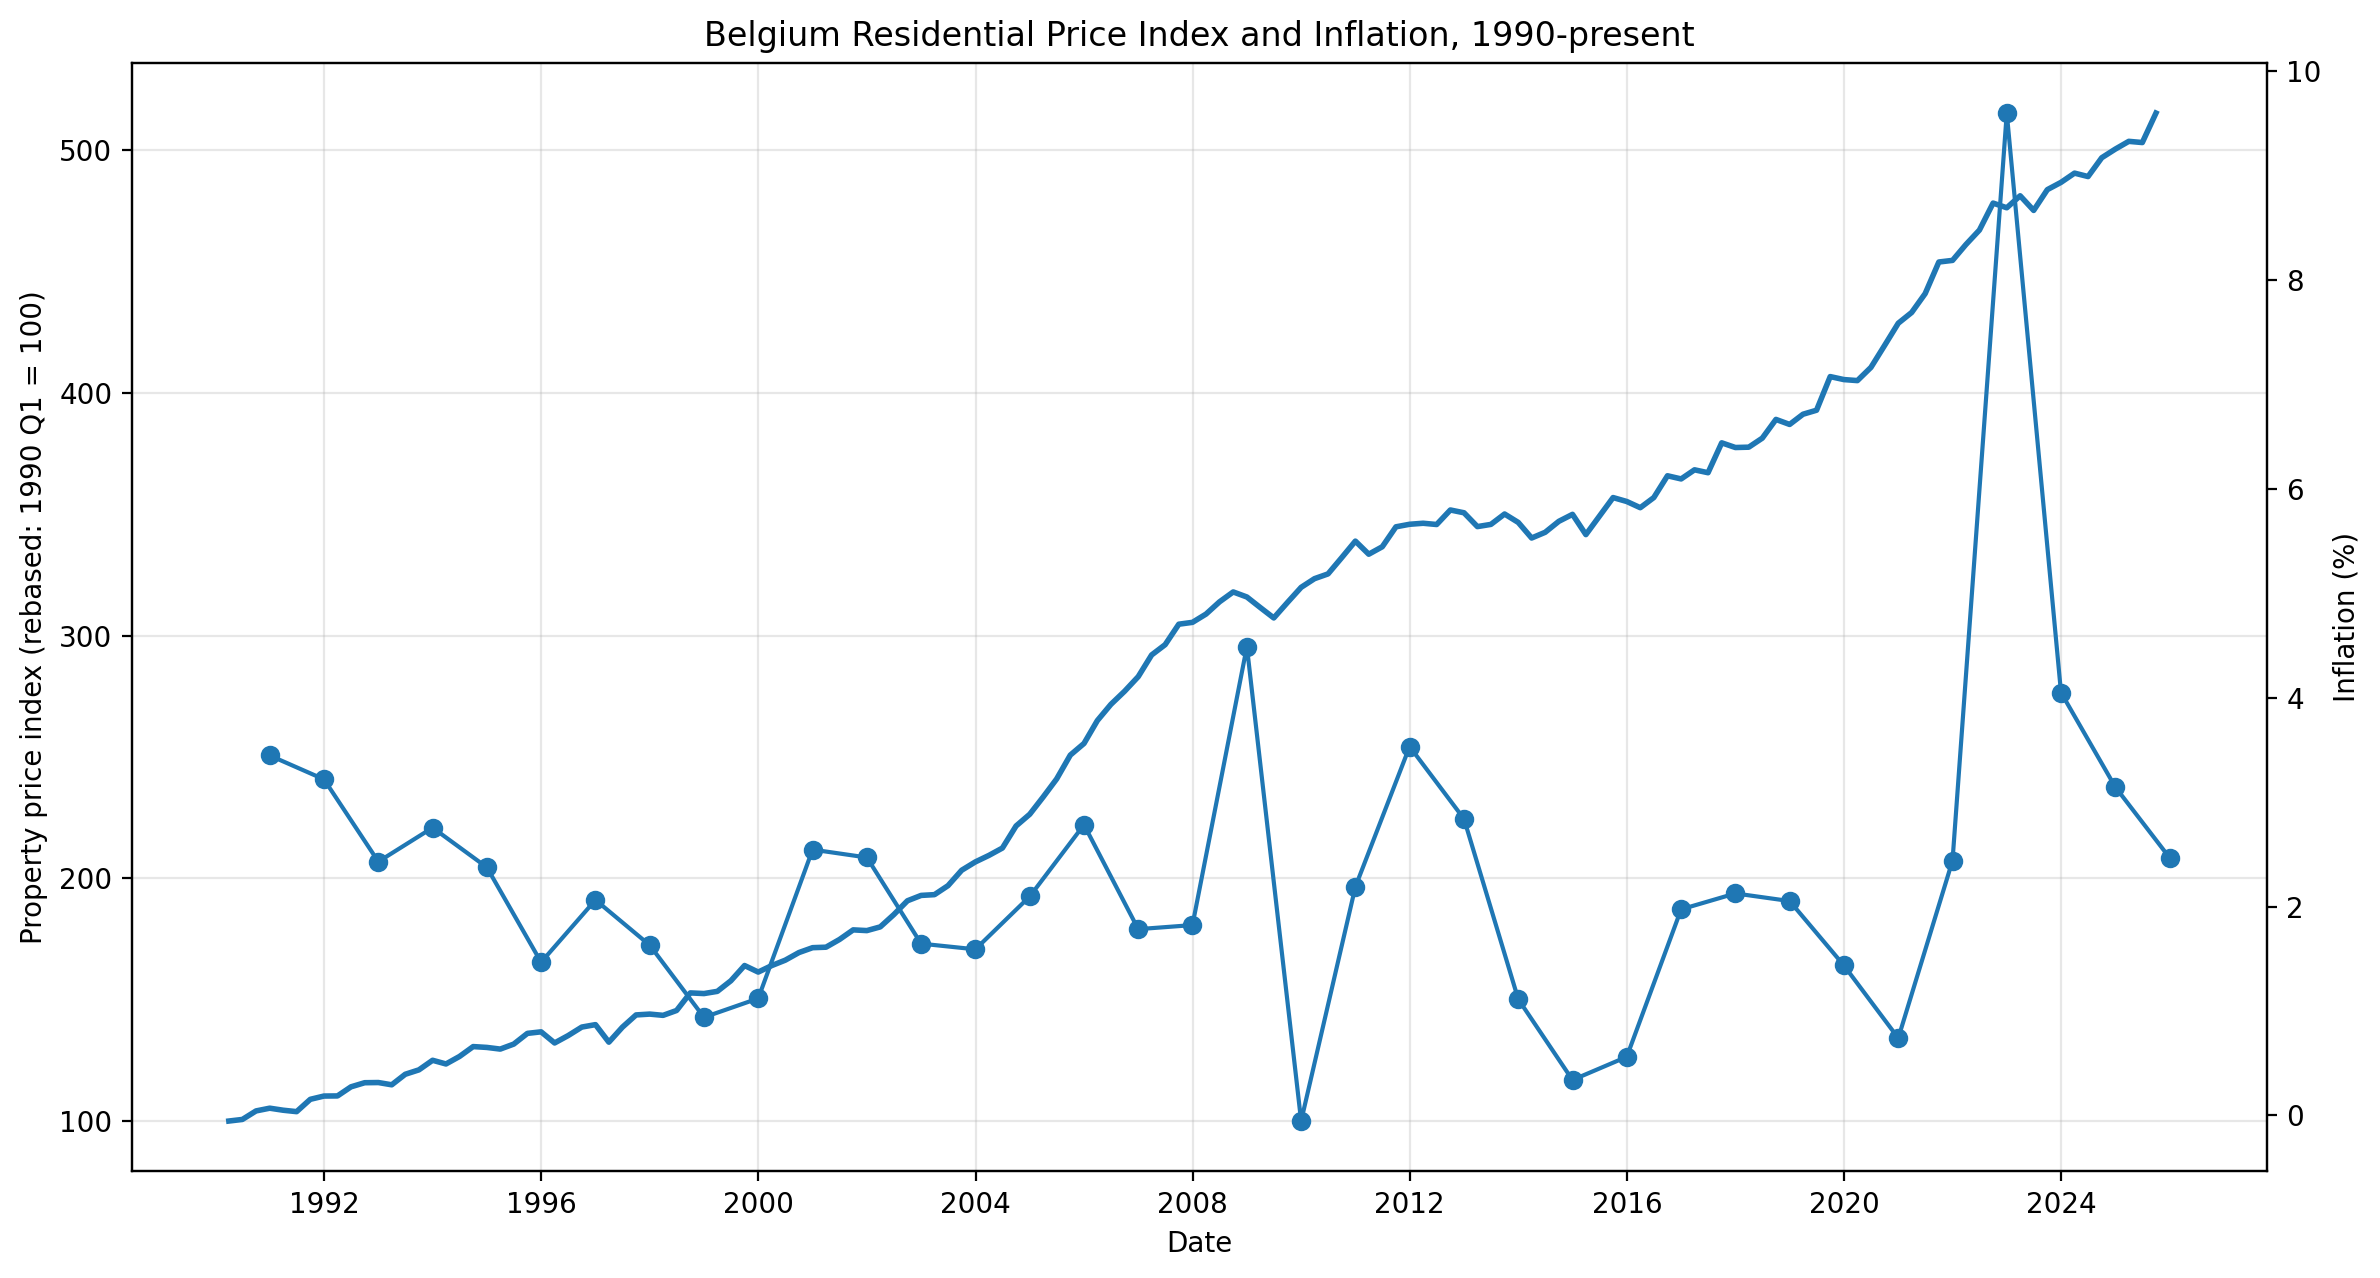
Property prices in Belgium: residential price index, existing dwellings
-
Global Property Guide – Square Meter Prices by Country/City (last update jan. 2026)
-
This ratio is typically used for measuring undervaluation/overvaluation of real estate prices, calculated by dividing the gross rental yield by 100 so the higher the yield, the lower the price/rent ratio.